Correlações em R
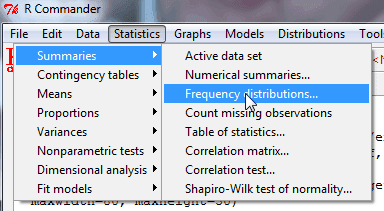
Tendo o Rcmdr instalado para fazer a análise de correlações basta escolher a opção no menu:

E depois indicar as variáveis para as quais se pretende obter a correlação.
As correlações são mostradas no SPSS numa forma de tabela com * que significam os vários níveis de significância.
Em R é possível fazer algo parecido.
corstarsl <- function(x){
require(Hmisc)
x <- as.matrix(x)
R <- rcorr(x)$r
p <- rcorr(x)$P
## define notions for significance levels; spacing is important.
mystars <- ifelse(p < .001, “***”, ifelse(p < .01, “** “, ifelse(p < .05, “* “, ” “)))
## trunctuate the matrix that holds the correlations to two decimal
R <- format(round(cbind(rep(-1.11, ncol(x)), R), 2))[,-1]
## build a new matrix that includes the correlations with their apropriate stars
Rnew <- matrix(paste(R, mystars, sep=””), ncol=ncol(x))
diag(Rnew) <- paste(diag(R), ” “, sep=””)
rownames(Rnew) <- colnames(x)
colnames(Rnew) <- paste(colnames(x), “”, sep=””)
## remove upper triangle
Rnew <- as.matrix(Rnew)
Rnew[upper.tri(Rnew, diag = TRUE)] <- “”
Rnew <- as.data.frame(Rnew)
## remove last column and return the matrix (which is now a data frame)
Rnew <- cbind(Rnew[1:length(Rnew)-1])
return(Rnew)
}
Depois de criada a função basta chamar a mesma para ver os resultados numa apresentação mais parecida com o SPSS.
corstarsl(Dataset)
Informação tirada de
http://myowelt.blogspot.com/2008/04/beautiful-correlation-tables-in-r.html
Outra forma de conseguir formatar a informação produzida no R é formatar o texto em blocos usando macros no excel para o fazer.
